Want more housing market stories from Lance Lambert’s ResiClub in your inbox? Subscribe to the ResiClub newsletter.
While national active inventory for sale is still rising year-over-year, the pace of growth has slowed in recent months—something we’ve been closely documenting for several months for our ResiClub members.
The side-by-side maps below help you to see that decelerated rate of inventory growth:
Left map: Year-over-year change in metro level active inventory between November 2023 and November 2024
Right map: Year-over-year change in metro level active inventory between November 2024 and November 2025
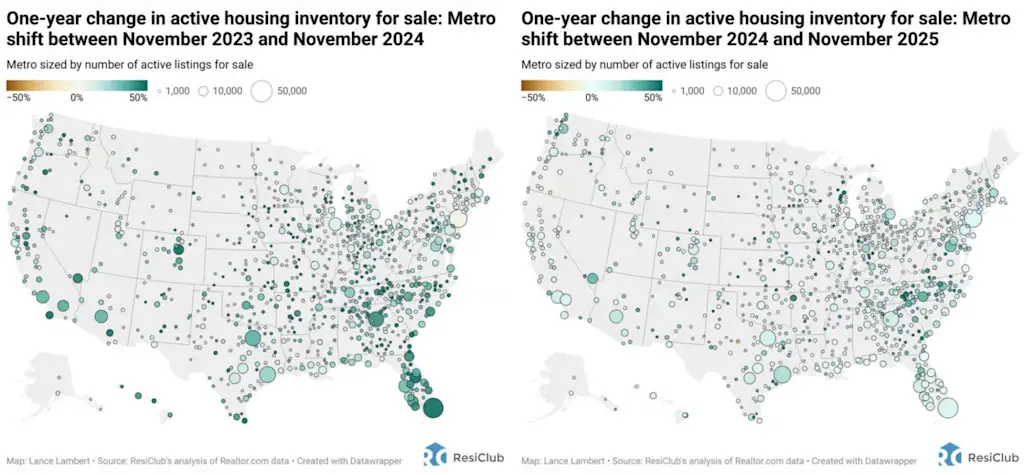
Between November 2023 and November 2024, U.S. active housing inventory for sale rose +26.1%.
Between November 2024 and November 2025, U.S. active housing inventory for sale rose +12.6%.
Some of that percentage deceleration is a denominator effect (i.e., as U.S. active inventory rises, it takes an even larger increase to generate the same year-over-year percentage gain). That said, the deceleration is not only due to a denominator effect.
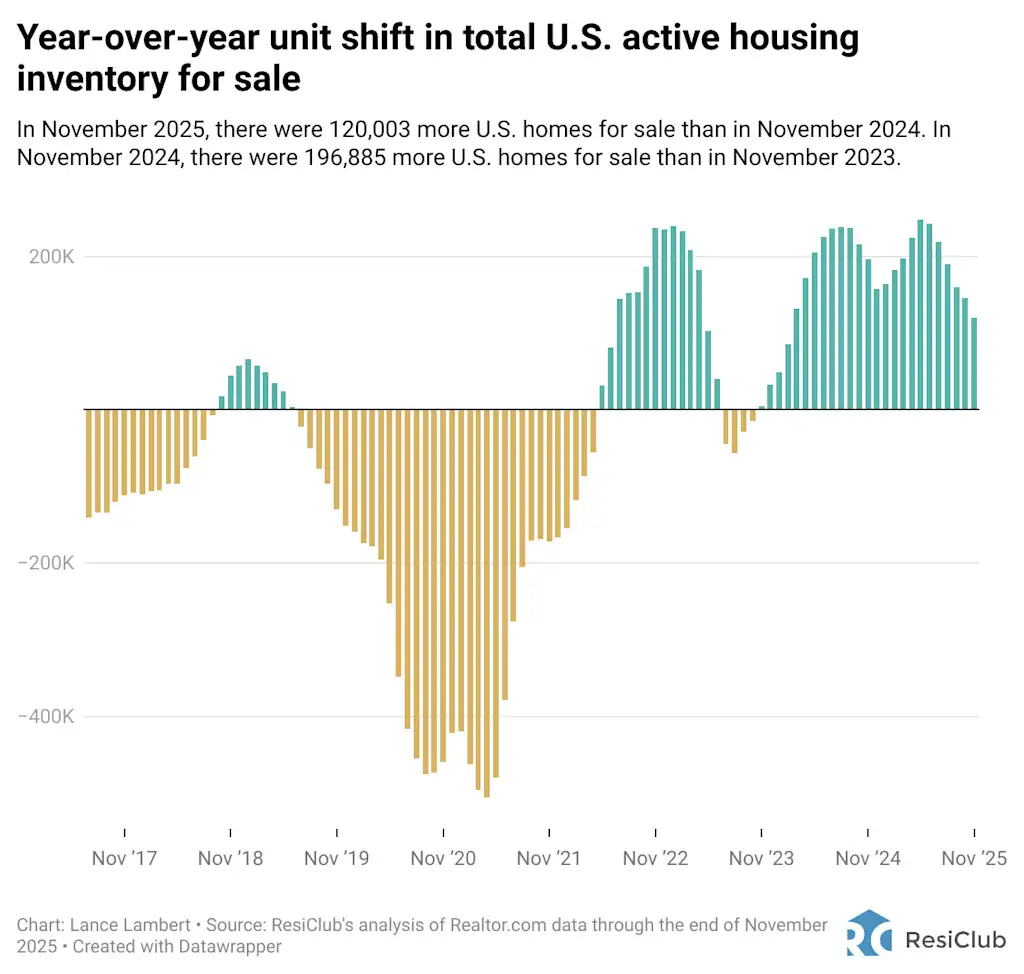
In November 2024, there were +196,885 more U.S. homes for sale than in November 2023.
In November 2025, there were +120,003 more U.S. homes for sale than in November 2024.
The chart below—year-over-year unit shift in inventory—helps us to see the trend without the denominator effect:
Why has U.S. active inventory growth slowed?
Some of it is due to days on market not rising as quickly/stabilizing in some markets. Part of the slowdown reflects an increase in delistings in softer markets, as some sellers have thrown in the towel and pulled their listings.
And, to a lesser degree, a handful of markets have seen a mild pickup in absorption, as existing-home sales have edged up slightly from their multiyear troughs.
What does decelerating inventory growth mean?
Back in September, I published an article titled: “The speed of housing market softening has slowed—but softness remains.”
I think that framing still holds for what we’ve seen in recent months. On a nationally aggregated basis, as inventory growth decelerated in the second half of 2025, so did the pace of market softening.
Since then, the U.S. housing market has largely stabilized, with national home price appreciation hovering close to 1% year-over-year and below U.S. income growth.
Of course, there remains significant regional variation: Many pockets of the Midwest and Northeast continue to see mild year-over-year home value gains, while many areas in the Southwest and Southeast are experiencing mild year-over-year declines.
What to watch in early 2026?
As the nationally aggregated housing market transitions from its seasonally slower period into its seasonally busier spring window, a key question will be how inventory behaves.
In particular, it will be important to watch whether the recent uptick in delistings in softer markets come back online. For example, do homes that were pulled from the market in weaker areas—such as Southwest Florida—quickly reappear once seasonality shifts?
Discover more from The Veteran-Owned Business Blog
Subscribe to get the latest posts sent to your email.

You must be logged in to post a comment.