Small business activity was up again in May, as the number of employees working (+1%) and hours worked (+1.9%) increased and performed slightly better than the last year
With stable growth across Main Street, hourly workers are feeling more content, with 4 out of 5 saying they’re happy with their jobs. Concerns around inflation and non-work stresses declined by 6% and 5%, respectively.
Noteworthy trends this month:
- While wages are still important to hourly workers, non-monetary criteria like flexible work environments and relationships with coworkers are key factors in determining where they work.
- As turnover ticked up 11.7% in May m/m, so did hiring activity (+6.0%), with small businesses hiring additional workers potentially expecting an increase in demand
- Summer is here! Outdoor businesses are growing. The Northern region is growing.
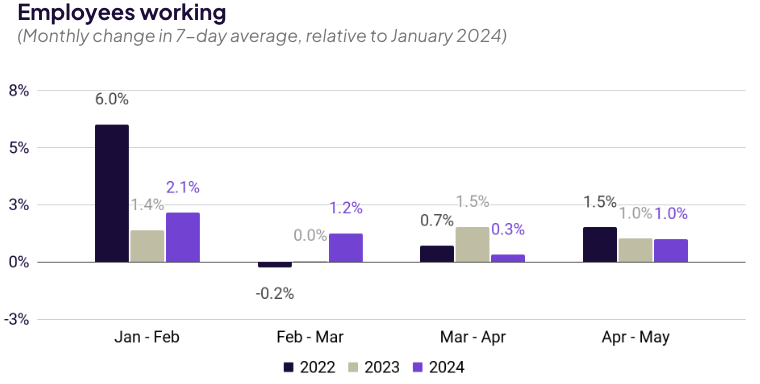
2024 business activity shows signs of recovery in growth
Subhead: The onset of summer seems to draw slightly higher gains in employment activity than last year.
Employees working
(Monthly change in 7-day average, relative to January 2024)
Hours worked
(Monthly change in 7-day average, relative to January 2024)
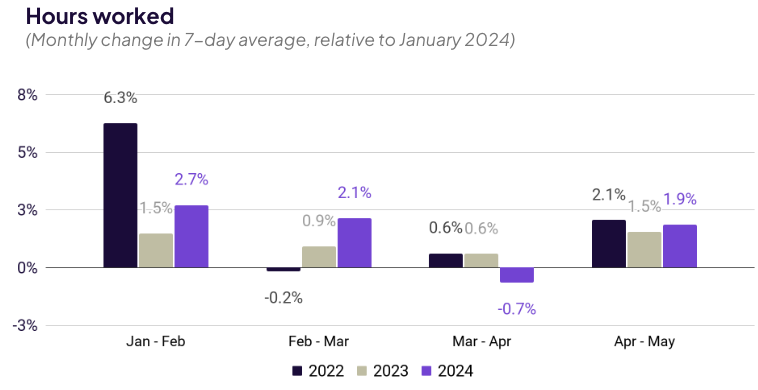
Note: Data compares rolling 7-day averages for weeks encompassing the 12th of each month.April 2023 data encompasses subsequent week to account for Easter holiday. Source: Homebase data.
Midwest, Northeast, and Western states driving growth
Southern states seem to have slowed down, which is consistent with pattern seen this time last year
Output by Region
Month-over-month change in core economic indicators, by Census region
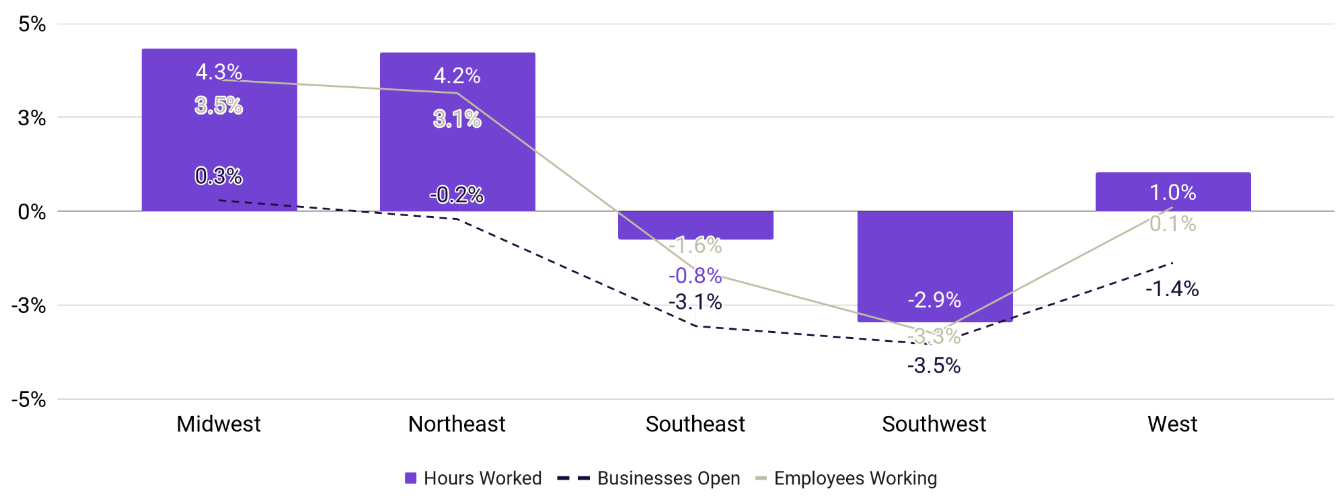
Note: April 7-13 vs. May 12-18. Region classification – Midwest: ND, SD, NE, KS, MN, IA, MO, WI, IL, IN, OH, MI; West: NV, UT, AZ, NM, CO, WY, MT, ID, OR, WA, CA, HI, AK; Northeast: NY, PA, NJ, CT, RI, MA, NH, VT, ME; Southeast: MS, AL, TN, KY, NC, SC, GA, FL; Southwest: TX, OK, AR, LA. Source: Homebase data
Outdoor businesses are booming, similar to last year
Foot traffic is driving a particularly hot period for Entertainment, Hospitality, and Home & Repair businesses
Small businesses in the Hospitality (+5.4%), Entertainment1 (+8.7%), and Home & Repair (+4.7%) sectors outperformed seasonal expectations in May, continuing recent trend
The Retail and Food & Drink industries also saw increased work activity, but not quite at the level of prior years.
Percent change in employees working
(Mid-May vs. mid-April, using Jan. ‘22, Jan. ‘23, and Jan. ‘24 baselines)
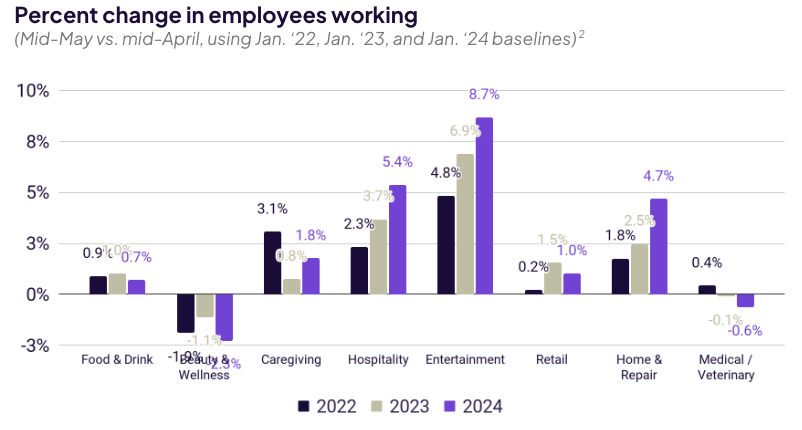
- Entertainment includes events/festivals, sports/recreation, parks, movie theaters, and other categories.
- April 10-16 vs. May 8-14 (2022); April 16-22 vs. May 7-13 (2023); April 7-13 vs. May 12-18 (2024). April 2023 data encompasses subsequent week to account for Easter holiday. Source: Homebase data
No wage growth in May
Entertainment has seen the steepest decline, however, it aligned with last year’s pattern
Avg. wage changes, m/m
Monthly change in average hourly wages across all jobs
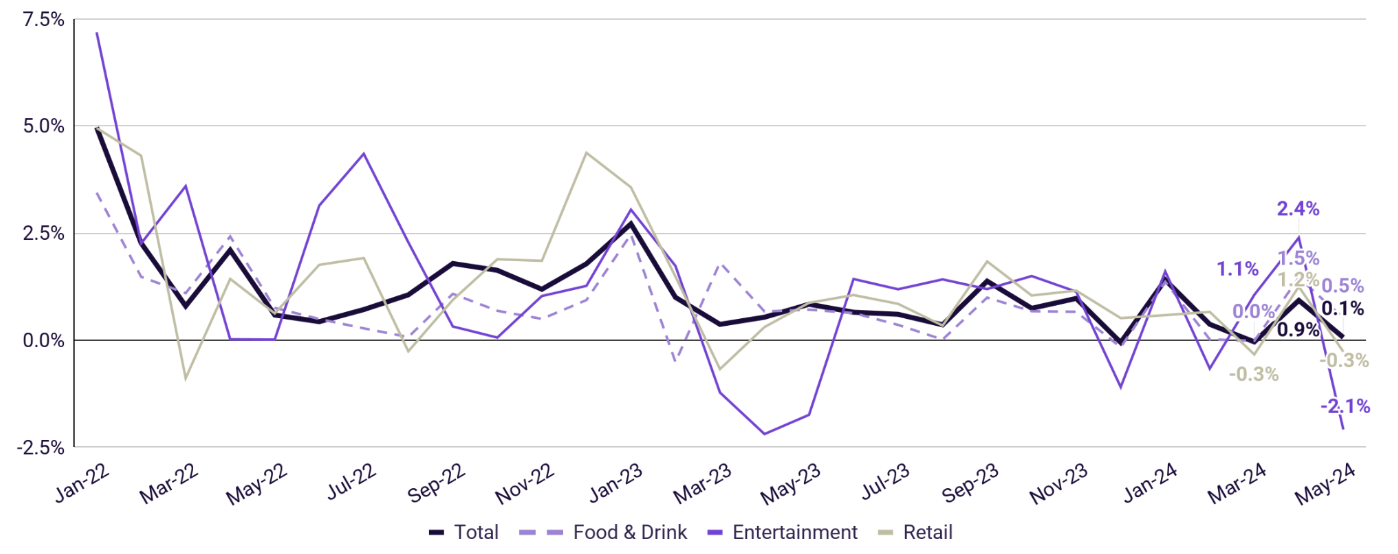
Note: Data measures average hourly wages for locations that utilized Homebase to pay employees in both May 2024 and May 2023. Total includes industries not depicted here. Source: Homebase Payroll data.
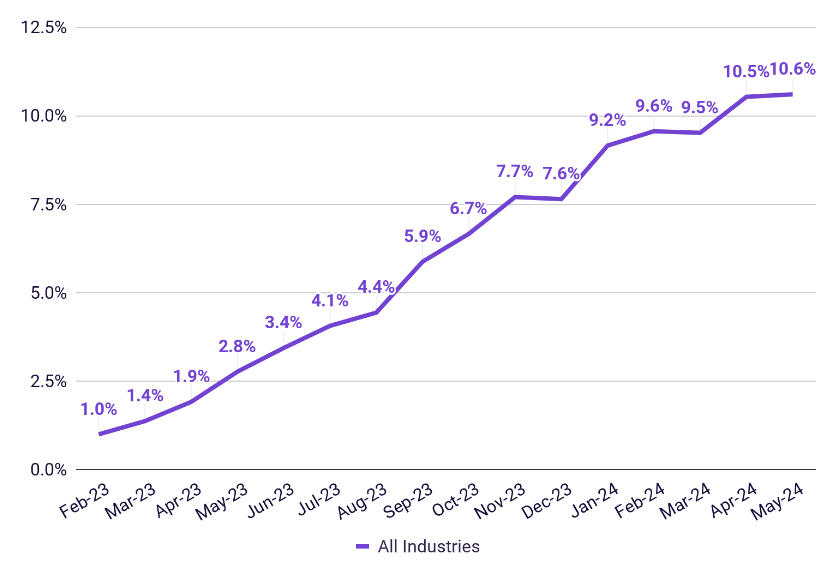
Labor costs are slowing, remain 30% above 2022 levels
Growth in hiring activity led to a marginal increase in wages in May
Avg. hourly wages
Percent change in average hourly wages across all jobs, relative to January 2022
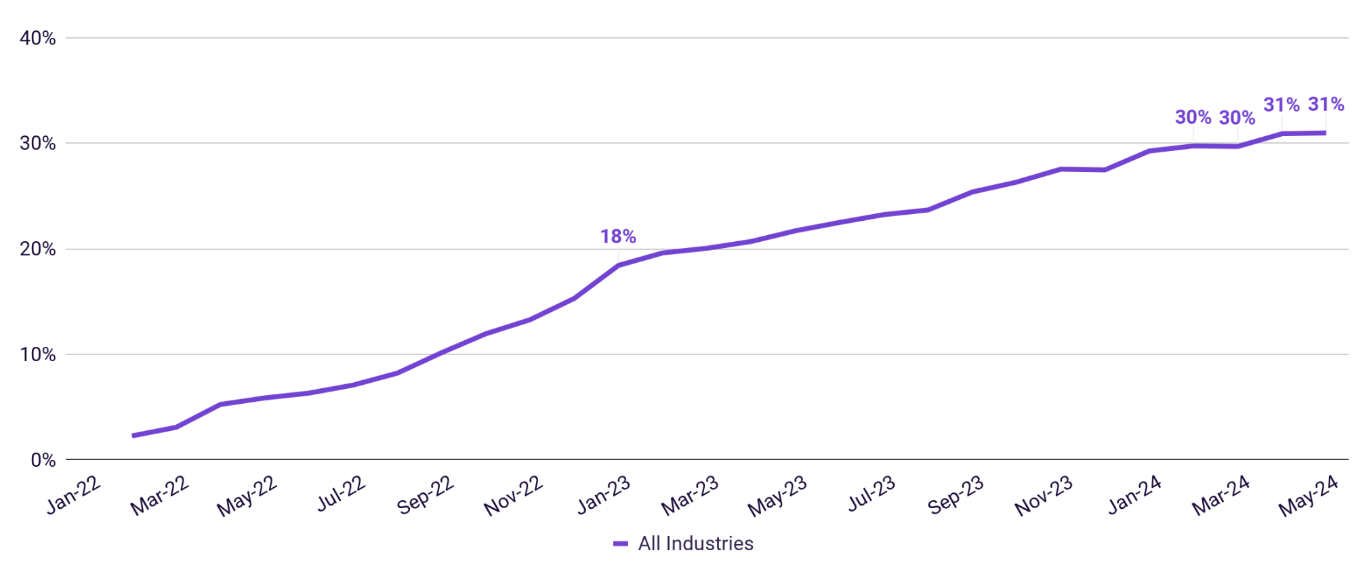
Note: Data measures average hourly wages for locations that utilized Homebase to pay employees in both May 2024 and March 2023. Source: Homebase Payroll data.
Hiring continues to grow m/m, since March 2024
Owners continue to hire additional workers to keep up with growth, albeit at a lower rate than seen historically
m/m changes in average jobs created
Monthly change in average number of jobs added across all jobs
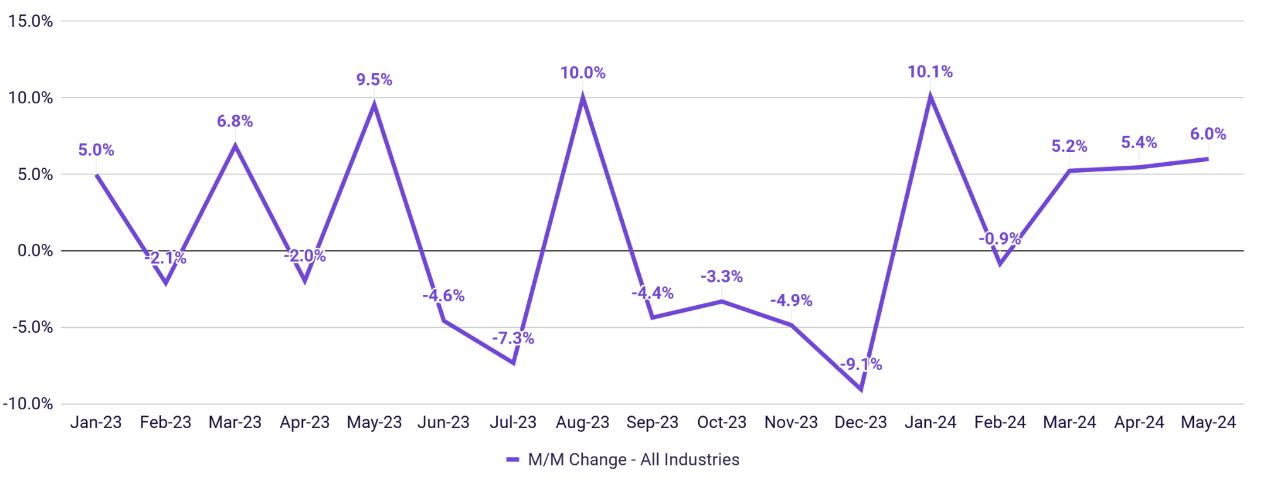
Note: Data measures average monthly change in total number of jobs created in official employee rosters for companies active in any given month. Source: Homebase data.
Turnover for May came in lower than seasonally expected compared to the last year
m/m changes in average number of jobs removed
Monthly change in average jobs archived across all jobs
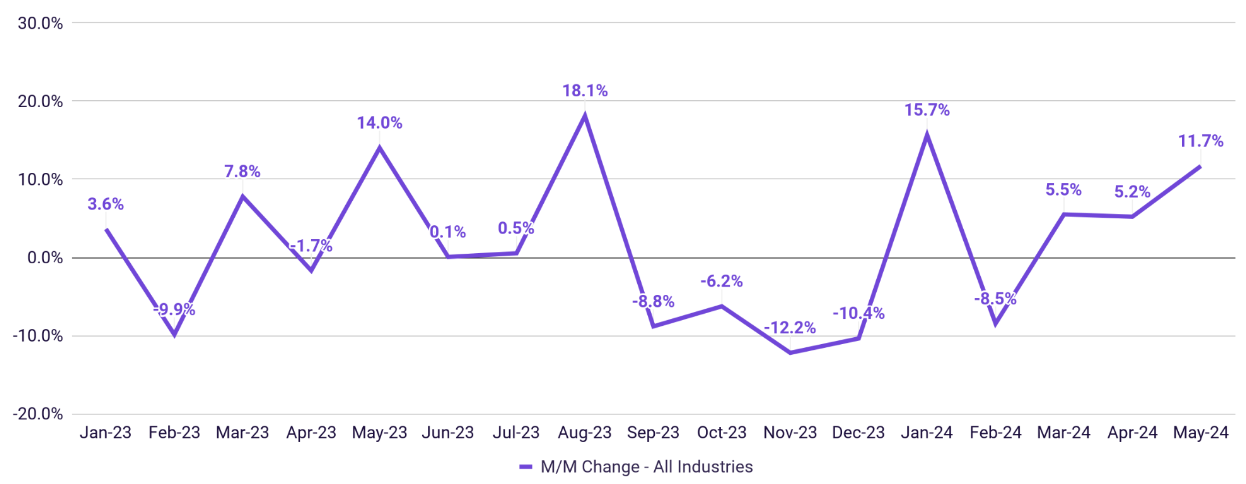
Note: Data measures average monthly change in total number of jobs removed, whether by voluntary or involuntary exit, from official employee rosters for companies active in any given month. Source: Homebase data.
Hourly employee pulse check
May 2024
Employee optimism holds steady
36% of employees surveyed reported optimism about their job prospects in a year, as steady wage increases and business at existing employers buoys expectations about the coming months.
Consistently positive outlook in the workforce amid healthy economic activity on Main Street bodes well for small businesses this summer.
Do you think your job options will be better, about the same, or worse in 12 months compared to today?

Source: Homebase Employee Pulse Survey
N = 873 (Feb. ‘23); N = 666 (Apr. ‘23); N = 611 (Jun. ‘23); N = 427 (Aug. ‘23); N = 437 (Oct. ‘23);
N = 575 (Jan. ‘24); N = 652 (Mar. ‘24); N = 3214 (May ‘24)
On Main Street, employees are feeling less anxiety
Worries are still present for employees of small businesses, but they’re generally starting to wane. In May, concern about inflation and about non-work stresses decreased by 6% and 5%, respectively.
The specter of economic hardship (recession, job loss) is taking up less mindshare for hourly employees during a time of increased consumer demand.
Looking ahead, which of the following factors are you concerned about?
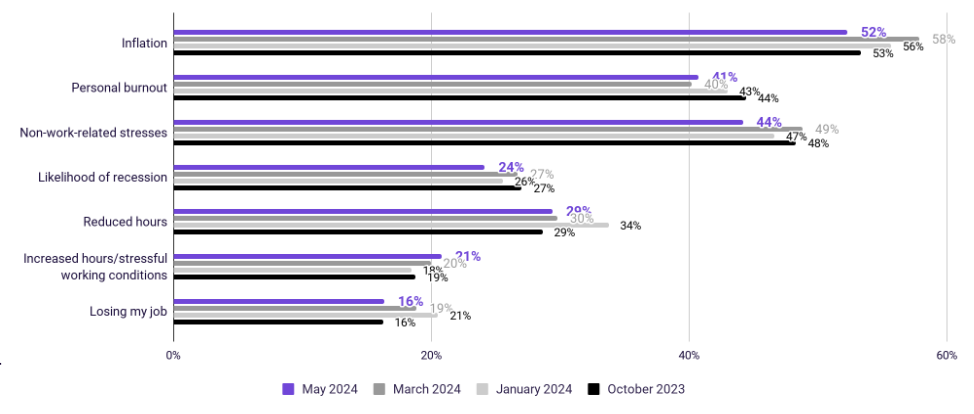
Source: Homebase Employee Pulse Survey.
N = 427 (Aug. ‘23); N = 437 (Oct. ‘23); N = 575 (Jan. ‘24); N = 652 (Mar. ‘24); N = 3214 (May ‘24)
Flexible work and workplace relations are the top drivers for employee retention
While wages are important, creating a positive work environment in non-monetary ways is the deciding factor for employees on where they choose to work
Rank the top 3 most important factors in your decision on where you work
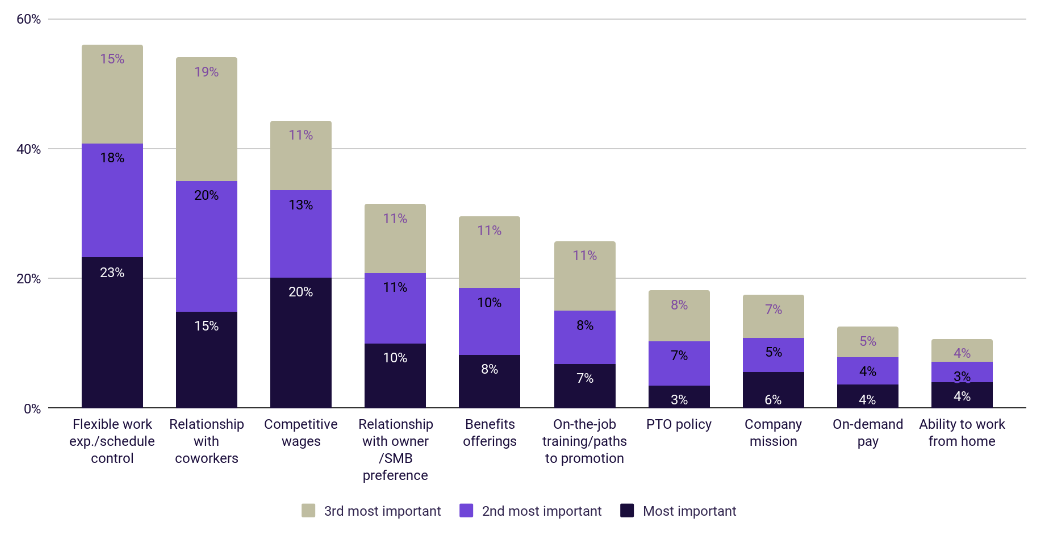
Source: Homebase Employee Pulse Survey. N = 3214 (May ‘24)
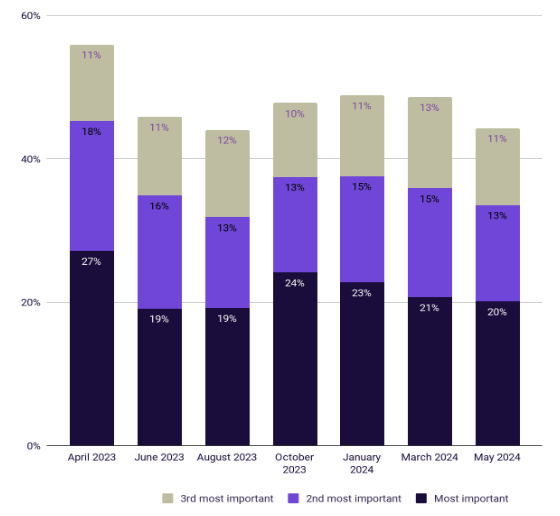
To employees, wages are becoming more of a given
Rank the top 3 most important factors in your decision on where you work (“Competitive wages”)
Avg. hourly wages
Percent change in average hourly wages across all jobs, relative to January 2023
Source: Homebase Payroll Data/Homebase Employee Pulse Survey. N = 666 (Apr. ‘23); N = 611 (Jun. ‘23); N = 427 (Aug. ‘23); N = 437 (Oct. ‘23); N = 575 (Jan. ‘24); N = 652 (Mar. ‘24); N = 3214 (May ‘24).
Note: Data measures average hourly wages for locations that utilized Homebase to pay employees in both May 2024 and May 2023.
Employee sentiment around job satisfaction continues to be positives and stable
Roughly 4 in 5 hourly workers agree they’re happy with their jobs overall.
With general concerns about the future abating, the majority of surveyed employees report feeling satisfied with their jobs and level of compensation.
To what extent do you agree with the following sentence: “Overall, I am happy with my job.”
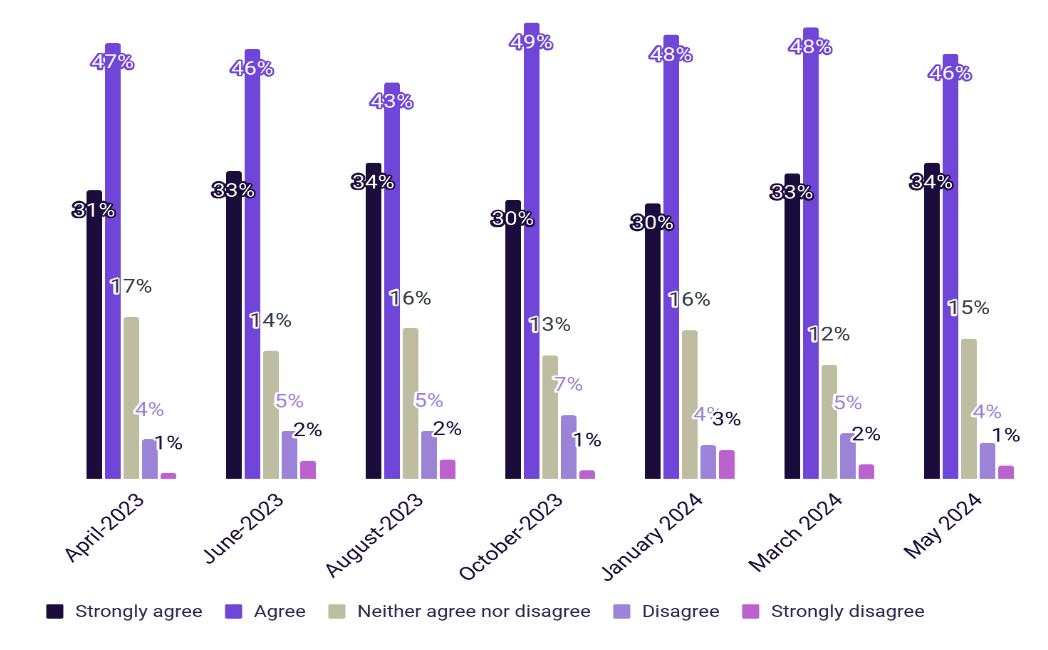
To what extent do you agree with the following sentence: “Overall, I am satisfied with my level of compensation.”
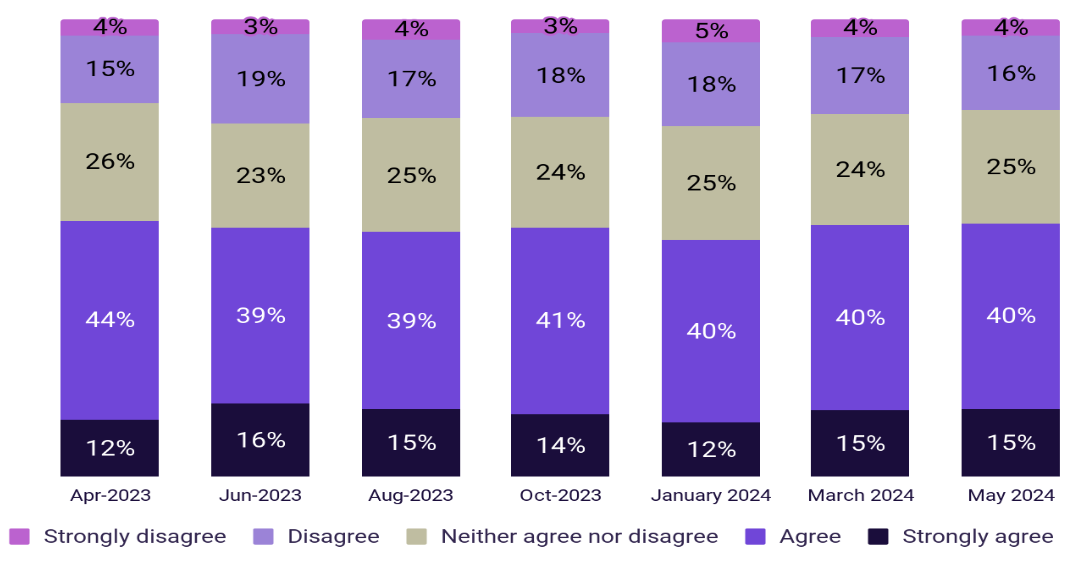
Source: Homebase Employee Pulse Survey
N = 666 (Apr. ‘23); N = 611 (Jun. ‘23); N = 427 (Aug. ‘23); N = 437 (Oct. ‘23);
N = 575 (Jan. ‘24); N = 652 (Mar. ‘24); N = 3214 (May ‘24)
View a PDF of our full May 2024 Main Street Health Report. If you choose to use this data for research or reporting purposes, please cite Homebase.
The post May Main Street Health Report: Small businesses see robust hiring activity in contrast with broader economy appeared first on Homebase.
SOURCE: https://joinhomebase.com/blog/may-main-street-health-report-small-businesses-see-robust-hiring-activity-in-contrast-with-broader-economy/ https://joinhomebase.com/

You must be logged in to post a comment.